
growkar is an R-package to visualize and analyze growth curve data from timely recorded optical density by spectrophotometers.
Install
if(require("devtools")){
        devtools::install_github("sethiyap/growkar")
} else{
        install.packages("devtools")
        devtools::install_github("sethiyap/growkar")
}
Plot growth curve
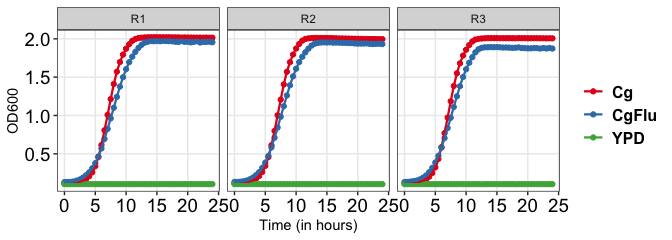
Individual replicate
growkar::plot_growth_curve(dat_growth_curve = growkar::yeast_growth_data, palette_name="Set1")
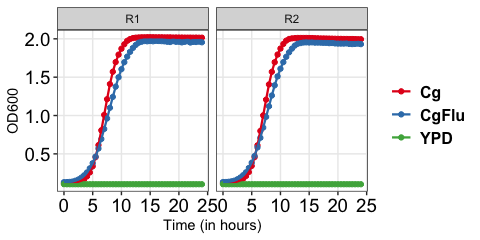
With specific replicates
growkar::plot_growth_curve(dat_growth_curve = growkar::yeast_growth_data, average_replicates = FALSE, select_replicates = c("R1", "R2"), palette_name="Set1")
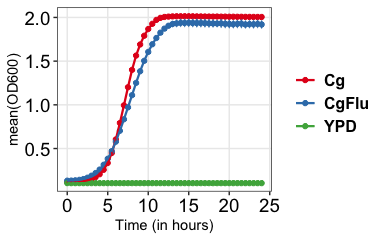
Average of replicates
# Vertical lines represent standard deviation

growkar::plot_growth_curve(dat_growth_curve = growkar::yeast_growth_data, average_replicates = TRUE, palette_name="Set1")
Computation of growth rate and generation time
Growth rates have often been used to evaluate the measure of fitness. Logarithmic phase of the curve is used to determine the growth-rate. Here, late lag-phase and early stationary-phase is defined as actively dividing log-phase (as shown in figure).

Log-phase start (T1): the time-point at which OD (OD1) is double to that of the OD at the initial time-point (i.e., 0 hour) Log-phase end (T2): the time-point at which the OD (OD2) becomes twice of OD1.
Growth-rate is calculated as described in (Ng et al., 2016);
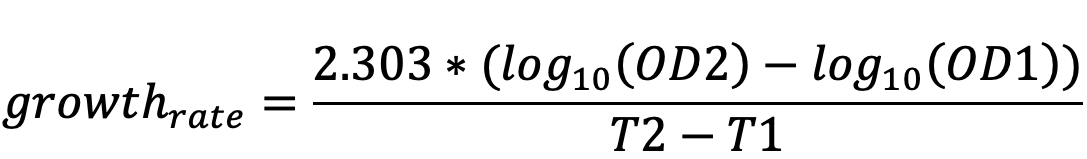
Growth rate (generation/hour); is the number of generations (doublings) per hour.
Doubling time (or generation time); is the time taken by the population to double:

The doubling time (minutes/doubling) is the reciprocal of the growth rate.
calculate_growth_rate
Individual replicate
cc <-  growkar::calculate_growth_rate(dat_growth_curve = growkar::yeast_growth_data)

knitr::kable(cc,"html", align = "l") %>%
    kableExtra::kable_styling(bootstrap_options = c("striped", "condensed", "responsive"), full_width = F,font_size =14,  stripe_color = "aquamarine3") %>%
    kableExtra::row_spec(0,bold = TRUE, italic = FALSE, color = "black") %>%
    kableExtra::column_spec(c(1, 5:6), bold=FALSE, color="blue")
|
condition1 |
replicate1 |
time1 |
time2 |
growth_rate |
doubling_time |
|---|---|---|---|---|---|
|
Cg |
R1 |
4.0 |
5.5 |
0.531 |
33.995 |
|
Cg |
R2 |
4.0 |
5.5 |
0.515 |
35.050 |
|
Cg |
R3 |
4.5 |
5.5 |
0.556 |
32.503 |
|
CgFlu |
R1 |
4.0 |
6.0 |
0.396 |
45.563 |
|
CgFlu |
R2 |
4.0 |
5.5 |
0.399 |
45.266 |
|
CgFlu |
R3 |
4.0 |
5.5 |
0.400 |
45.107 |
|
YPD |
R1 |
0.0 |
0.0 |
NaN |
NaN |
|
YPD |
R2 |
0.0 |
0.0 |
NaN |
NaN |
|
YPD |
R3 |
0.0 |
0.0 |
NaN |
NaN |
With specific replicates
cc <- growkar::calculate_growth_rate(dat_growth_curve =     growkar::yeast_growth_data, average_replicates = FALSE, select_replicates = c("R1", "R2"))

knitr::kable(cc,"html", align = "l") %>%
    kableExtra::kable_styling(bootstrap_options = c("striped", "condensed", "responsive"), full_width = F,font_size =14,  stripe_color = "aquamarine3") %>%
    kableExtra::row_spec(0,bold = TRUE, italic = FALSE, color = "black") %>%
    kableExtra::column_spec(c(1,5:6), bold=FALSE, color="blue")
|
condition1 |
replicate1 |
time1 |
time2 |
growth_rate |
doubling_time |
|---|---|---|---|---|---|
|
Cg |
R1 |
4 |
5.5 |
0.531 |
33.995 |
|
Cg |
R2 |
4 |
5.5 |
0.515 |
35.050 |
|
CgFlu |
R1 |
4 |
6.0 |
0.396 |
45.563 |
|
CgFlu |
R2 |
4 |
5.5 |
0.399 |
45.266 |
|
YPD |
R1 |
0 |
0.0 |
NaN |
NaN |
|
YPD |
R2 |
0 |
0.0 |
NaN |
NaN |
Average of replicates
cc <- growkar::calculate_growth_rate(dat_growth_curve = growkar::yeast_growth_data, average_replicates = TRUE)

knitr::kable(cc,"html", align = "l") %>%
    kableExtra::kable_styling(bootstrap_options = c("striped", "condensed", "responsive"), full_width = F,font_size =14,  stripe_color = "aquamarine3") %>%
    kableExtra::row_spec(0,bold = TRUE, italic = FALSE, color = "black") %>%
    kableExtra::column_spec(c(1, 4:5), bold=FALSE, color="blue")
|
condition |
time1 |
time2 |
growth_rate |
doubling_time |
|---|---|---|---|---|
|
Cg |
4.5 |
5.5 |
0.560 |
32.248 |
|
CgFlu |
4.0 |
5.5 |
0.397 |
45.501 |
|
YPD |
0.0 |
0.0 |
NaN |
NaN |
calculate_growthrate_from_defined_time
Using user defined logphase start and end time-point growth rate and generation time can be computed.
Individual replicate
# Load logphase start-end from local file

logphase_dat <- system.file("extdata", "logphase_for_replicates.txt", package = "growkar")
logphase_tibble <- readr::read_delim(logphase_dat, delim="\t", col_names = TRUE)

cc <-  growkar::calculate_growthrate_from_defined_time(dat_growth_curve = growkar::yeast_growth_data,logphase_tibble, average_replicates = FALSE)

knitr::kable(cc,"html", align = "l") %>%
    kableExtra::kable_styling(bootstrap_options = c("striped", "condensed", "responsive"), full_width = F,font_size =14,  stripe_color = "aquamarine3") %>%
    kableExtra::row_spec(0,bold = TRUE, italic = FALSE, color = "black") %>%
    kableExtra::column_spec(c(1, 5:6), bold=FALSE, color="blue")
|
condition |
replicate |
Time1 |
Time2 |
growth_rate |
doubling_time |
|---|---|---|---|---|---|
|
Cg |
R1 |
5.0 |
6.0 |
0.597 |
30 |
|
Cg |
R2 |
5.0 |
6.0 |
0.577 |
31 |
|
Cg |
R3 |
5.5 |
7.0 |
0.538 |
34 |
|
CgFlu |
R1 |
6.0 |
7.0 |
0.370 |
49 |
|
CgFlu |
R2 |
5.0 |
6.5 |
0.408 |
44 |
|
CgFlu |
R3 |
5.5 |
6.5 |
0.397 |
45 |
|
YPD |
R1 |
0.0 |
0.0 |
NaN |
NaN |
|
YPD |
R2 |
0.0 |
0.0 |
NaN |
NaN |
|
YPD |
R3 |
0.0 |
0.0 |
NaN |
NaN |
Average of replicates
# Load logphase start-end from local file

logphase_dat <- system.file("extdata", "logphase_for_replicates.txt", package = "growkar")
logphase_tibble <- readr::read_delim(logphase_dat, delim="\t", col_names = TRUE)

cc <-  growkar::calculate_growthrate_from_defined_time(dat_growth_curve = growkar::yeast_growth_data,logphase_tibble, average_replicates = TRUE)

knitr::kable(cc,"html", align = "l") %>%
    kableExtra::kable_styling(bootstrap_options = c("striped", "condensed", "responsive"), full_width = F,font_size =14,  stripe_color = "aquamarine3") %>%
    kableExtra::row_spec(0,bold = TRUE, italic = FALSE, color = "black") %>%
    kableExtra::column_spec(c(1, 4:5), bold=FALSE, color="blue")
|
condition |
Time1 |
Time2 |
growth_rate |
doubling_time |
|---|---|---|---|---|
|
Cg |
5.167 |
6.333 |
0.582 |
31 |
|
CgFlu |
5.500 |
6.667 |
0.385 |
47 |
|
YPD |
0.000 |
0.000 |
NaN |
NaN |